Why Choose Us ?
Created by passionate IITians, The Price Pilot team builds TradingView-based technical analysis tools designed to assist traders across multiple markets including NIFTY, BANK NIFTY, SENSEX, FOREX, and CRYPTO.
01
Real-Time Market Signals
Tools designed to highlight possible buy/sell areas based on live market data.
02
Data Driven Alerts
Signals and markers generated with algorithmic logic that can be reviewed through TradingView’s replay and backtesting features.
03
Risk Management Support
Indicators display suggested stop-loss and target zones for better planning and discipline.
04
Multi-Timeframe Analysis
Helps traders compare different timeframes to build a broader market perspective.
05
Sentiment & Volume Tracking
Visual tools to observe shifts in market sentiment and trading volume.
06
Learning + Indicator Integration
Designed as an educational aid, combining chart patterns, price zones, and smart visuals for practical use.
07
Research-Based Models
Developed using structured strategies and tested across different market instruments for adaptability.
Our Indicators
We understand that markets are complex and no single approach works for everyone. Price action, volume, supply and demand, liquidity, sentiment, and momentum — each factor plays an important role in shaping market behavior.
That’s why our platform provides a range of technical analysis indicators, with each tool focusing on a specific aspect of the market. This way, traders can select the indicator that best supports their individual analysis style and decision-making process.
Nova Quant V7
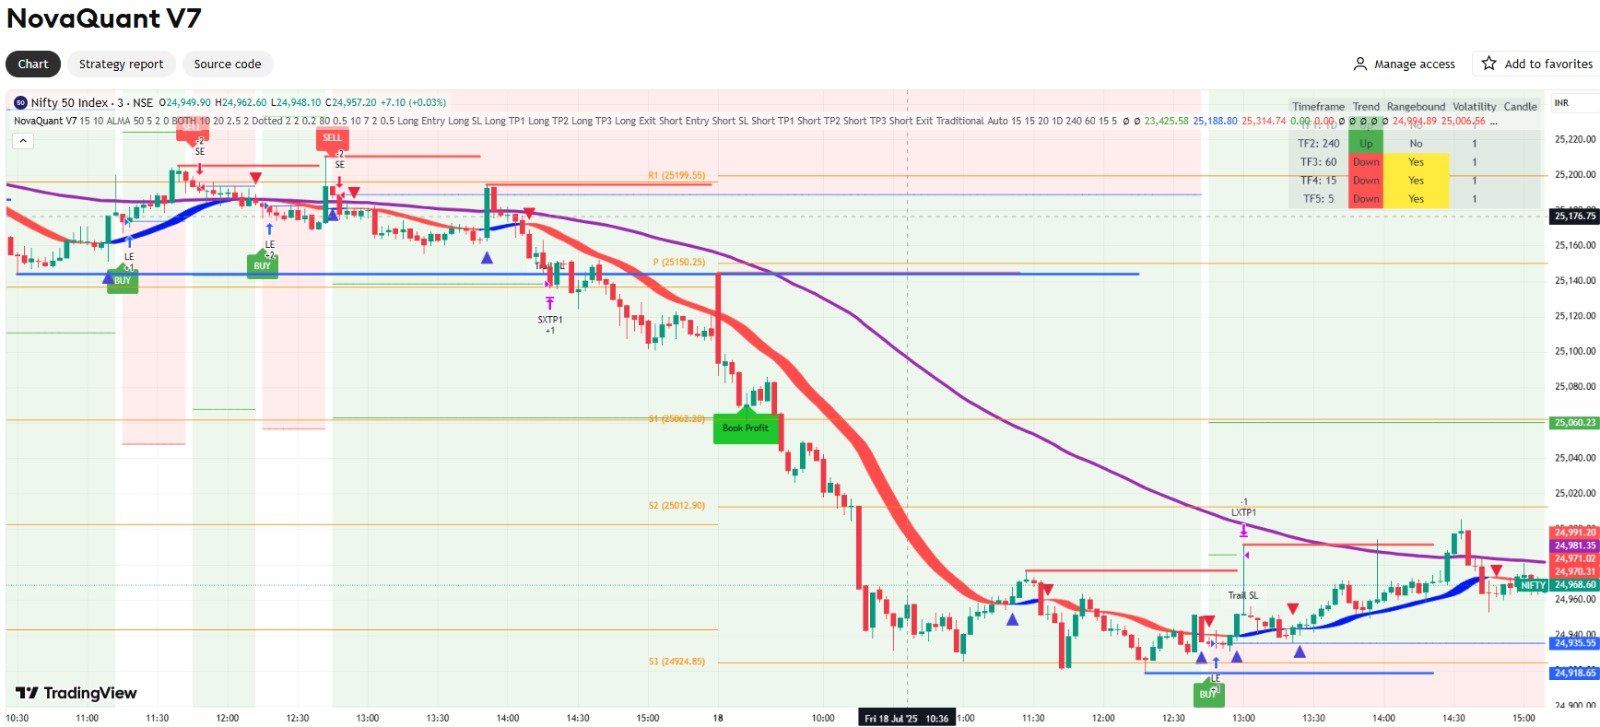
Nova Quant V7 is designed to provide structured market insights through advanced charting features.
Key Features
📊 Signal Highlights
The algorithm marks potential buy/sell areas on the chart with smart filtering — helping traders observe price behavior more clearly.
🟢 Non-Repainting Stability
Once signals appear, they remain fixed, ensuring transparency for backtesting and review.
🎯 Defined Market Zones
Visual markers highlight possible entry and exit areas, assisting in planning trade setups with greater clarity.
🧱 Dynamic Support & Resistance
Automatically maps key levels on the chart, based on evolving price structure.
Disclaimer: Nova Quant V7 is a technical analysis tool. The signals and zones it highlights are for informational and educational purposes only, not investment advice. They do not guarantee accuracy, profitability, or eliminate risks. Please consult a SEBI-registered investment advisor before taking trading decisions.
Rouge v3.1
Rouge v3.1 is designed to combine modern technical analysis concepts with traditional market tools, making chart-reading more structured and accessible for traders.
Key Highlights
✔ Integrates classic technical approaches with advanced filtering logic
✔ Built with simplicity in mind, making it useful for traders at different experience levels
✔ Applicable across multiple asset classes — Stocks, Crypto, Forex, and Indices
✔ Focused on delivering clearer visual insights to support informed decision-making.
Disclaimer: Rouge v3.1 is a technical analysis indicator intended for educational and informational purposes. It does not guarantee accuracy, profitability, or certainty in trading outcomes. Please consult your SEBI-registered investment advisor before making financial or trading decisions.
Heat Map - Buyer & Seller Strength Zones
The Heat Map is designed to provide a visual representation of buyer (🟢 green) and seller (🔴 red) strength across critical price zones. By highlighting these shifts in market activity, traders can better understand where momentum may be increasing or weakening.
Key Features
✔ Visualises buying and selling pressure in real time
✔ Highlights important price zones where market strength is concentrated
✔ Helps traders interpret momentum shifts with more clarity
✔ Useful for reviewing potential entry/exit areas during market analysis
Disclaimer: The Heat Map is a market analysis tool. It does not confirm or guarantee entries, exits, or trading results. All insights are for educational purposes only. Trading and investing involve risk. Please consult a SEBI-registered investment advisor before making financial decisions.,
Disclaimer: The indicators offered here are educational and analytical tools only. They are not recommendations to buy, sell, or hold any security or derivative instrument. Trading and investing carry risk of loss. Please consult a SEBI-registered investment advisor before making investment decisions.

